
Dashboard
The Dashboard is your central hub for daily operations in Chisel Tide. When you sign in, this is where you land—a single page that shows your business at a glance and provides quick access to routes, work orders, customers, and messages.
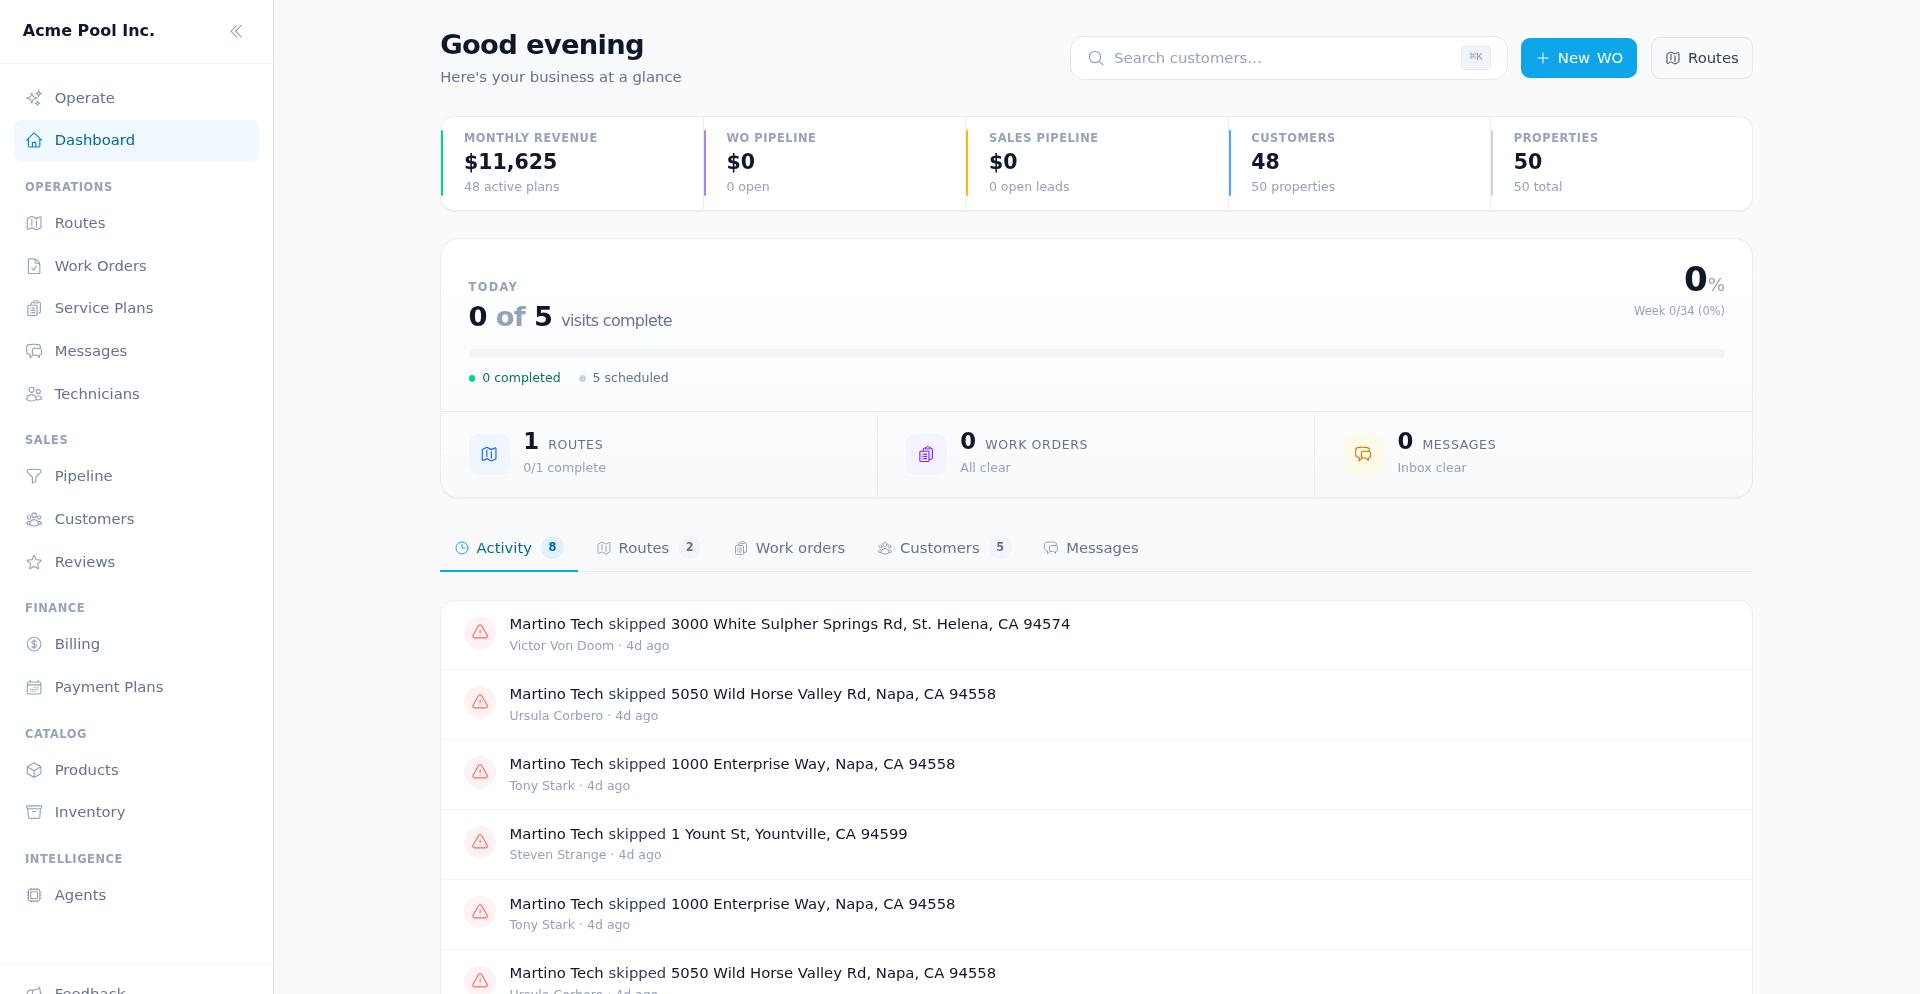
Dashboard layout
The Dashboard is organized into three main areas: the header with quick actions, a KPI strip showing key metrics, the Today summary, and a tabbed section for detailed lists.
Search bar
The top of the page provides a search bar to let you quickly look up a customer. Try entering the customer's name, or part of their address, or phone number. You can click on the search results to take you to the detail page for a customer.
Primary actions
Two buttons sit in the header for your most common tasks:
New WO — Opens the work order creation form to add a new repair, maintenance, or installation job. Takes you to
/work-orders/new.Routes — Jumps to the Routes page where you can view, create, and manage today's and upcoming routes. Takes you to
/routes.
KPI strip
Below the header, five metric tiles give you an instant snapshot of business health:
Monthly revenue — Your revenue for the current month.
WO pipeline — Total value of work orders in your pipeline.
Sales pipeline — Value of open sales opportunities.
Customers — Total number of active customers.
Properties — Total properties you service.
Each tile links to its detail page—click to drill into the underlying data.
Today summary
The Today section shows your day's progress at a glance:
Routes today — How many routes are scheduled and their completion status.
Work orders — Active work orders requiring attention.
Messages — Unread customer messages that need a reply.
A progress bar shows visits complete versus total for the day, helping you track technician progress in real time.
Dashboard tabs
The bottom portion of the Dashboard contains five tabs, each showing a detailed list with status indicators and quick links.
Activity
The Activity tab shows a live feed of service visit completions and skips as technicians work through their routes. Each entry displays:
Technician name
Property and customer information
Status (completed or skipped)
Time elapsed
Empty state: If no activity has occurred yet today, you'll see "No recent activity" with the message: "Service visit completions and skips will show up here as your techs work through the day."
Routes
The Routes tab displays routes organized into two sections:
Today — Routes currently in progress, showing real-time progress with current-stop status.
Upcoming — Future routes with date, assigned technician, stop count, and status. Each route links to its detail page.
Empty state: "No routes scheduled" appears when no routes are published, with the message: "Once routes are published they'll show up here with live progress and current-stop status."
Work orders
The Work orders tab lists active work orders with status badges and key details:
Pending — Work orders awaiting assignment or scheduling.
Active — Work orders currently in progress.
Completed — Finished work orders.
Pipeline — Total work order value in your pipeline.
Each row shows the work order title, number, customer, assigned technician (if any), total amount, and scheduled date. Click any row to open the full work order details.
Empty state: "No active work orders" with the message: "Work orders for repairs, maintenance, or installations will appear here."
Customers
The Customers tab shows your most recently added customers. Each entry displays customer initials, name, status indicator, property count, and when they were created. Click to view the customer record.
Empty state: "No customers yet" with the message: "As you add customers they'll appear here, most-recent first."
Messages
The Messages tab surfaces customer conversations that need attention. Unread messages and threads marked "Needs reply" appear here so you can respond quickly. Each row shows the customer name, last message preview, and timestamp.
Empty state: "Inbox is clear" with the message: "Customer conversations will show up here when there's something to read or reply to."
Data refresh and loading
The Dashboard automatically refreshes every 60 seconds, so you don't need to reload the page to see updated metrics, route progress, or new messages.
When the page loads, you'll see skeleton placeholders while data is fetched. If the Dashboard fails to load and no cached data exists, an error message "Failed to load dashboard" will appear—try refreshing the page or checking your connection.
Navigation tips
Jump to Routes — Click the "Routes" button in the header or navigate via the main menu.
Create a work order — Click "New WO" to open the work order form immediately.
Find a customer fast — Use
Cmd+KorCtrl+Kto open customer search without scrolling.Check today's progress — The Today summary and Activity tab give you a real-time view of field operations.
The Dashboard is designed to be your starting point each day—review your KPIs, check route progress, respond to messages, and create new work orders, all from one place.